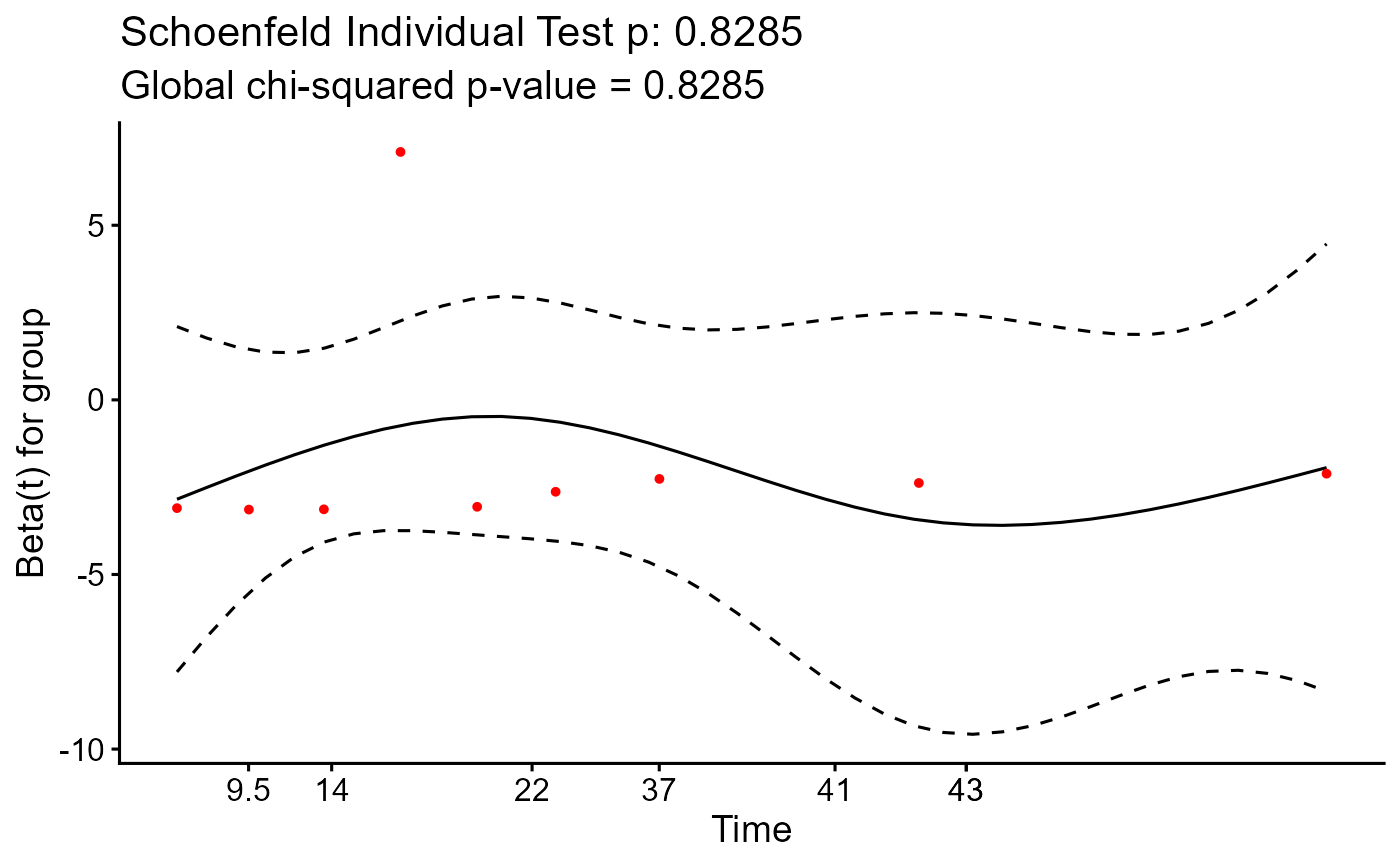
Plots Schoenfeld residuals to check the proportional hazards (PH) assumption for the final Cox model. Satisfies SRR **G3.1a**.
References
Cox, D. R. (1972). Regression Models and Life-Tables. *Journal of the Royal Statistical Society: Series B (Methodological)*, 34(2), 187-202. doi:10.1111/j.2517-6161.1972.tb00899.x
Examples
data(crc_virome)
fit <- find_cutpoint(
  data = head(crc_virome, 50),
  predictor = "Alphapapillomavirus",
  outcome_time = "time_months",
  outcome_event = "status",
  num_cuts = 1,
  method = "systematic"
)
#> ℹ Running systematic search...
#> ℹ Testing for 1 cut-point(s)...
#> ✔ Systematic search complete.
#>
#> ── Optimal Cut-point Analysis for Survival Data (Systematic) ───────────────────
#> • Predictor: Alphapapillomavirus
#> • Criterion: logrank
#> • Optimal Log-Rank Statistic: 2.8814
#> ✔ Recommended Cut-point(s): 3.764

if (!any(is.na(fit$optimal_cuts))) {
  plot_diagnostics(fit)
}
#> $`1`

#>
#>