Plot Optimisation Curve or Surface from Search
Source:R/plotting_functions.R
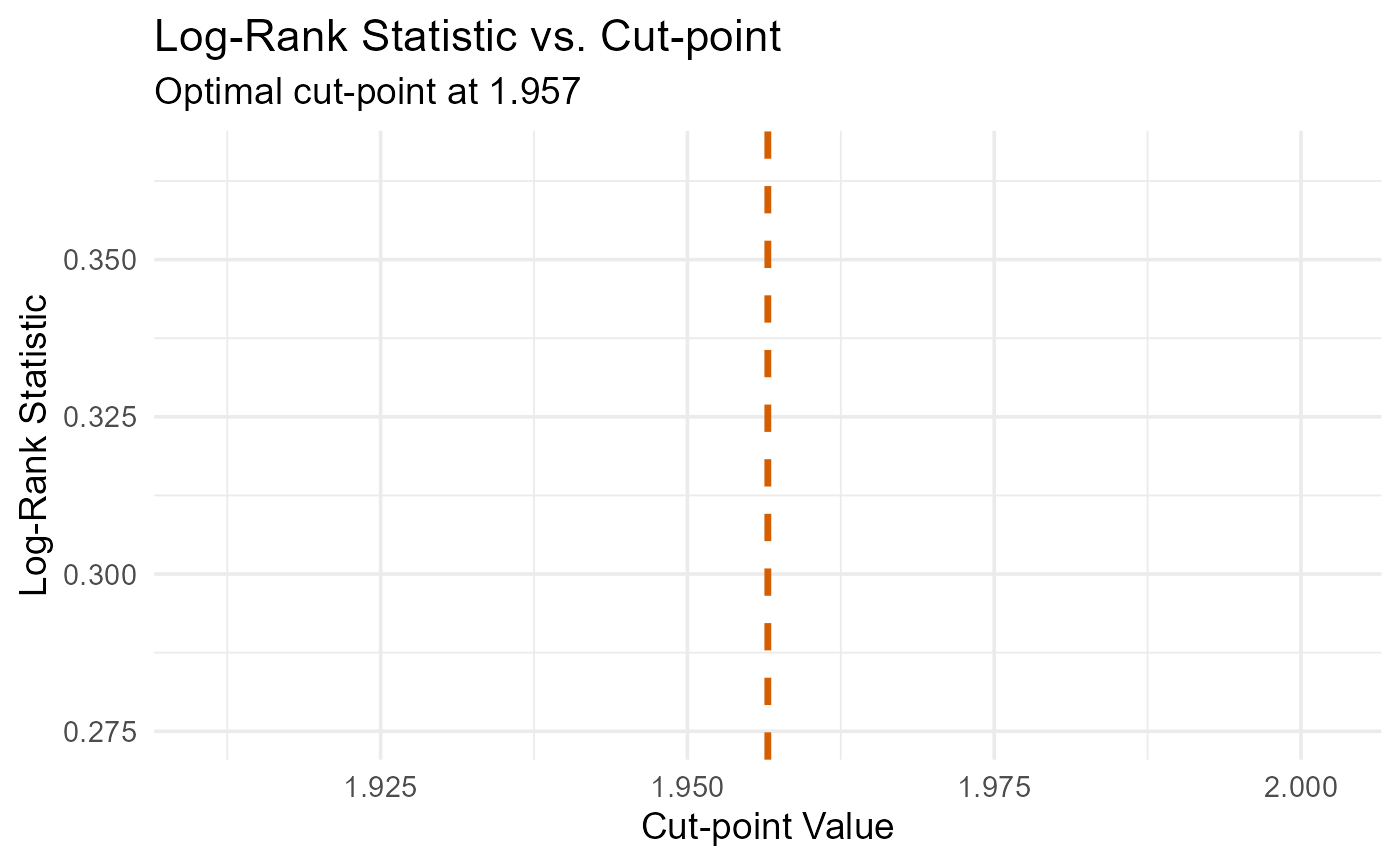
plot_optimisation_curve.RdPlots the metric landscape evaluated across coordinates. Maps a 1D optimisation line for 1-cut systematic setups, or a 2D topographic grid profile for 2-cut layouts.
Examples
library(survival)
data(pbc, package = "survival")
pbc_sub <- na.omit(pbc[1:60, c("time", "status", "bili")])
pbc_sub$event <- as.integer(pbc_sub$status %in% c(1, 2))

# Execute a minimal 1-cut systematic search to generate the grid landscape
res <- find_cutpoint(
  data          = pbc_sub,
  predictor     = "bili",
  outcome_time  = "time",
  outcome_event = "event",
  num_cuts      = 1,
  method        = "systematic"
)
#> ℹ Running regularised systematic search for 1 cut-point(s)...
#> ✔ Systematic grid optimisation complete.

# Plot the 1D metric optimisation curve
plot_optimisation_curve(res)
#> Warning: Removed 41 rows containing missing values or values outside the scale range
#> (`geom_line()`).